38
seven (7) accidents involving employees oc-
curred, with interruption of work. These
took place in our Metallurgy & Mining sec-
tor subsidiaries in Greece. In particular, six (6)
accidents involving employees of the Group
(five men and one woman) occurred in
ALUMINIUM S.A,. in the company’s Alumi-
na Maintenance, Anodes and Vehicle Repair
Shop Departments. The sixth accident took
place in DELPHI-DISTOMON S.A., in one of
the company’s underground sites, involved a
contractor’s employee and was the first ac-
cident in the company after an accident-free
period of 50 months.
These accidents involved injuries sustained by
the employees in their upper and lower limbs
and their causes are related to factors such as
risk identification failures and non-compliance
with safety instructions. All incidents were
analysed using the “Cause Tree Analysis”
method, the lessons learnt from them were ab-
sorbed and understood, and corrective actions
were planned (including, for each action, a per-
son in a charge, a deadline and a completion
date), with a view to briefing employees and
to preventing any conditions which could
cause such accidents to happen again from
arising. In addition to the thorough technical
inspections and the necessary improvements
applied in all cases of accidents, special
measures were also taken, including:
A 45-day emergency action plan for the
entire ALUMINIUM S.A. plant. As part of
the actions under the plan, the Man-
agement Safety Visits (MSVs) were
quadrupled.
For one week, the company’s Manage-
ment and senior executives held daily
Safety meetings with employees at their
working premises.
Application of the guideline for an ad-
ditional action plan for every activity in
which a deterioration in Safety results is
established.
Briefing of the personnel of the section
concerned and presentation of the inci-
dent’s causes and of the corrective ac-
tions taken.
Development of safety training videos on
SWR (Safe Work Rules).
Reminder to the personnel of the section
concerned of the work list and of the ba-
sic moves.
The number of required Personal Safety
Actions (PSAs) for every management ex-
ecutive was doubled for three months.
Re-examination and updating of in-
structions and briefing of the personnel
of the sections concerned on the com-
munication procedure in the event of an
accident.
Identification and coverage of needs re-
garding the installation of systems.
In addition, the following were also carried
out:
7,103 hours of training.
>70 PSAs and 10 MSVs per management
executive who received relevant training.
18 Health and Safety Visits.
12 inspections of subcontracts in
progress.
8 inspections of confined spaces.
15 installation lockout inspections.
12 circulation inspections.
200 measurements of work conditions &
harmful factors (e.g. noise, vibrations,
presence of fluoride).
735 regular employee medical check-ups.
The Health of employees is an equally im-
portant subject for ALUMINIUM S.A. and one
in which the company has been regularly in-
vesting since its very establishment. In 2013,
we succeeded in reporting, for the third con-
secutive year, nil incidents related to occu-
pational diseases. This is largely due to the
implementation of the Professional Risk As-
sessment (PRA) process. The PRA is a quan-
titative tool that relies on measurements of
harmful factors, which as a rule are carried
out by means of handheld samplers and in
general of measurement instruments that the
employees carry on their person during their
working day. After mathematical processing,
these measurements are compared to the ex-
posure limit values determined by the laws
in force. The processing of this data offers
the possibility of obtaining a comprehensive
inventory of the exposure of employees, on
the one hand, and of developing a compre-
hensive action plan to achieve the target of
“ZERO ACCIDENTS AT WORK”. Today, a
total of eight (8) harmful factors are mon-
itored systematically, including noise, dust,
fluoride compounds, sulphur dioxide, carbon
monoxide, polycyclic aromatic hydrocarbons,
thermal stress and beryllium.
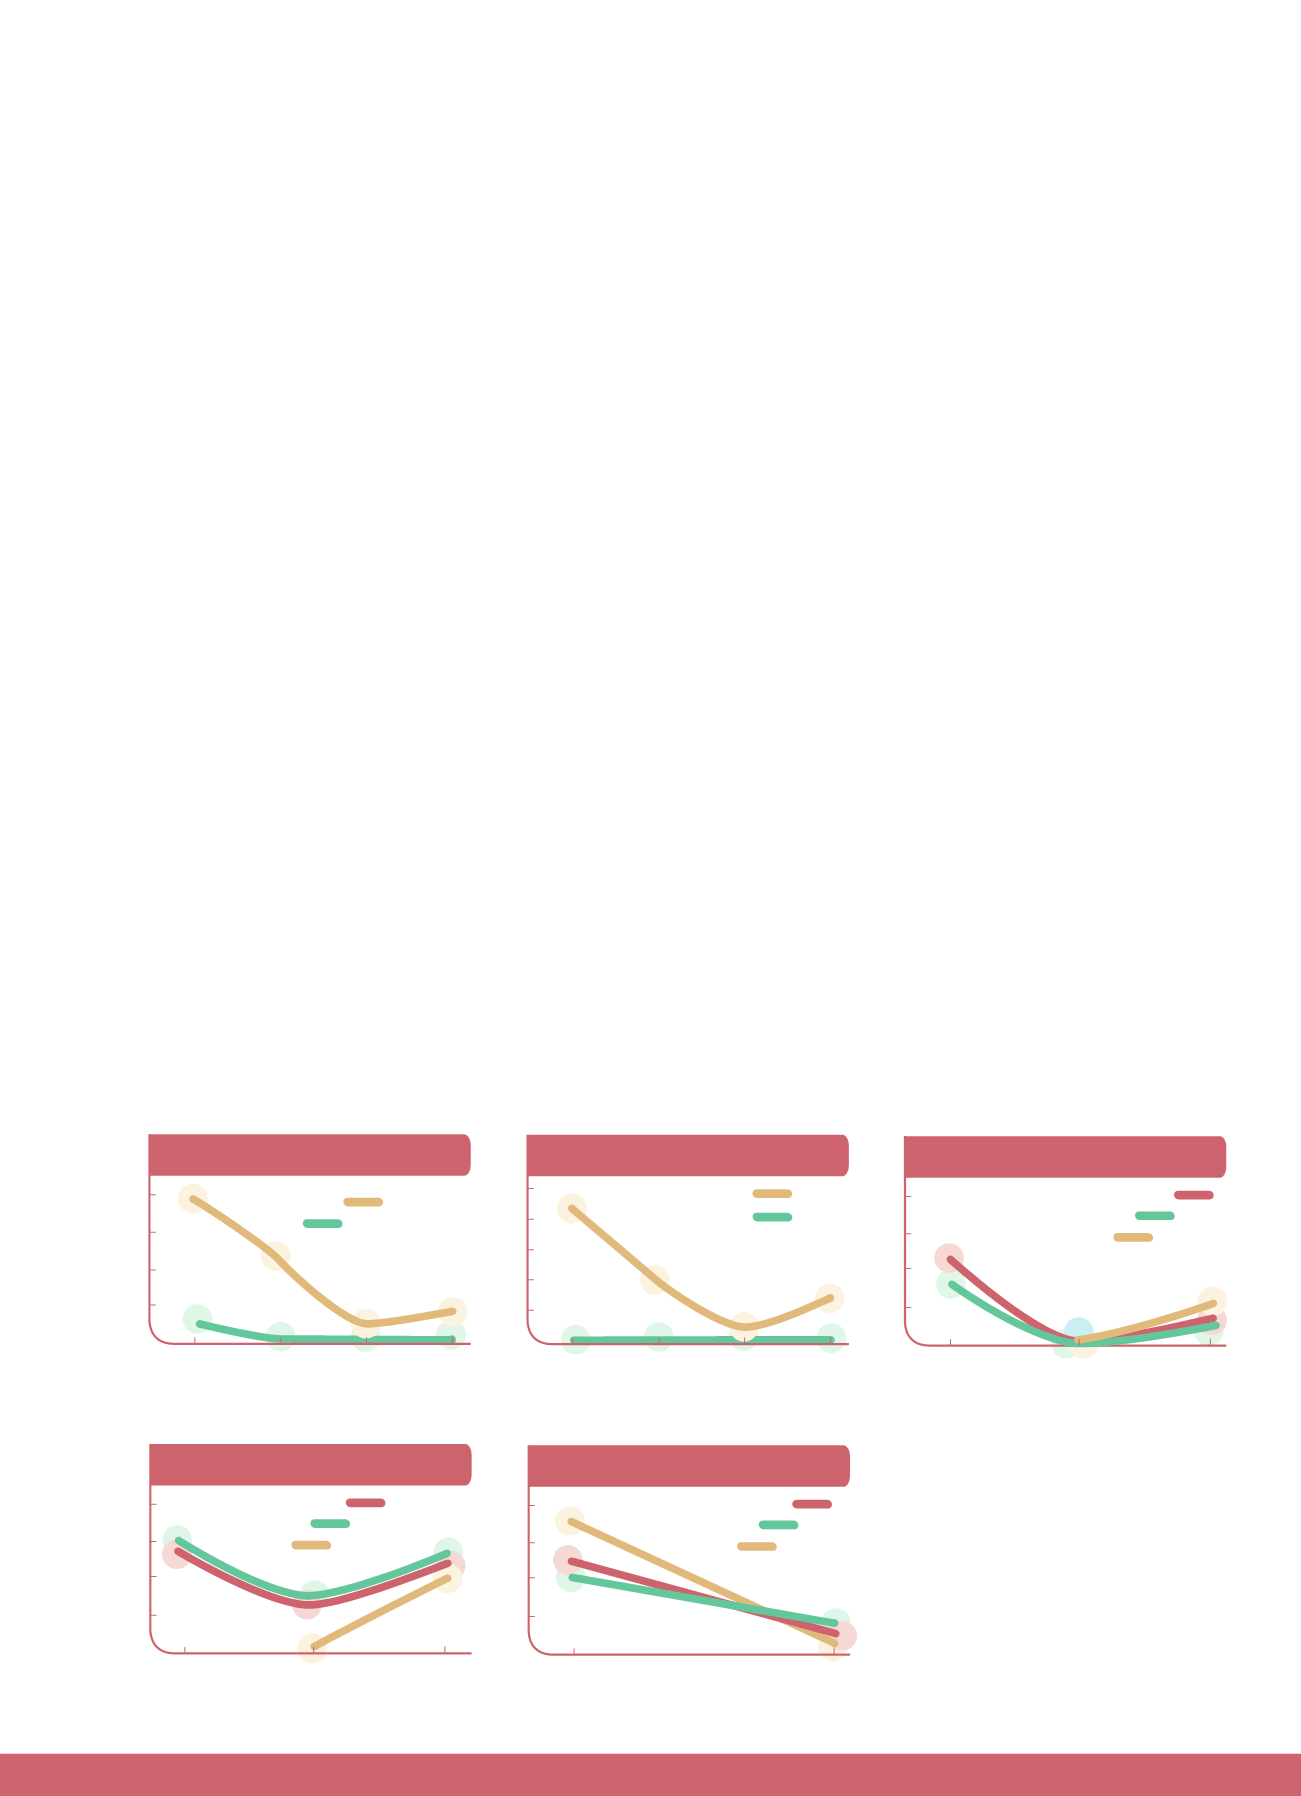
2
1
0
2010
2011
2012
2013
1.8
17569.1
12129.1
2826.7
4727.1
11821.8
4467.5
0.1
1.1
0.0
0.0
0.0
0.1
0.3
OCCUPATIONAL HEALTH
& SAFETY INDICATORS
Injury Rate (IR)
Occupational Diseases
Rate (ODR)
25
20
15
10
5
0
2010
2011
2012
2013
22
0
10
0
0
2
7
NUMBER OF ACCIDENTS & WORK -
RELATED FATALITIES
Accidents
Fatalities
0
2
1
0
2011
2012
2013
1.1
0.8
0.1
0.0
0.4
0.3
0.1
0.3
INJURY RATE (IR)
IR
IR (Men)
IR (Women)
20
15
10
5
0
2011
2012
2013
14.1
15.0
6.8
6.4
12.8
10.3
0.0
13.2
LOST DAYS RATE (LDR)
LDR
LDR (Men)
LDR (Women)
20000
15000
10000
5000
0
2012
2013
ABSENTEEISM RATE (AR)
ΑR
IR (Men)
IR (Women)
OCCUPATIONAL HEALTH & SAFETY
INDICATORS:
- Also include cases involving employees of inde-
pendent contractors, where the Group is responsi-
ble for ensuring the Health and Safety of their work
environment.
- The number of accidents does not include incidents
involving very light injuries.
- Days lost to accidents are calculated starting on
the day after the incident and refer to scheduled
work days.


