D
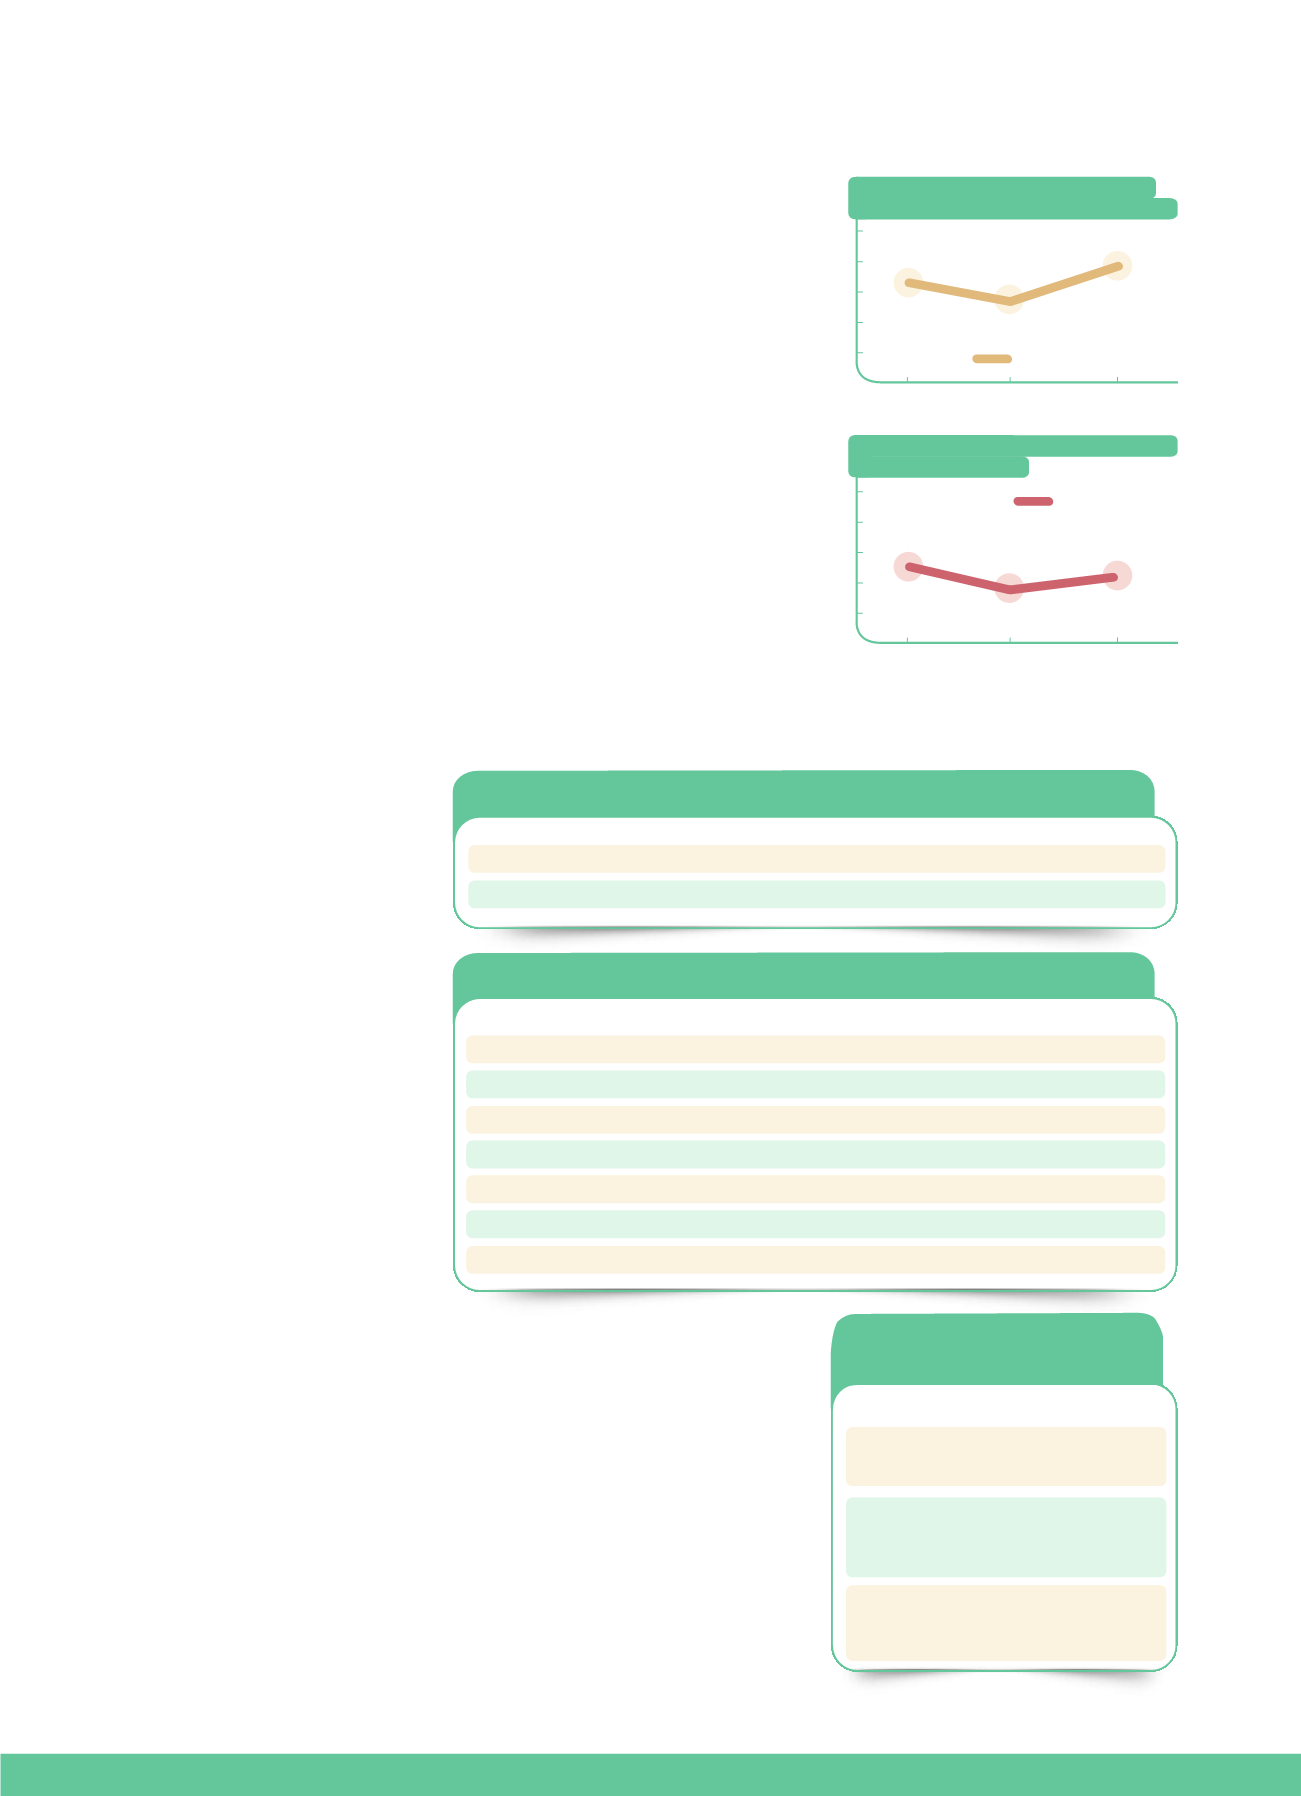
uring 2013, we recorded a total of 38 in-
cidents in the Metallurgy & Mining sec-
tor involving spillage in the soil of lubricants
weighing nearly 4.2 tons, a quantity increased
by 20% from the corresponding one for
2012. These spills were primarily due to
breakdowns in machinery caused during the
mining process in the tunnels of underground
quarries. By way of clarification, it should be
pointed out that these spills are an unavoid-
able part of the mining process, as they are
caused mainly by wear and tear of lubricant
pipes and by damages to machinery by falling
rocks. In addressing this problem, our subsidiary
DELPHI-DISTOMON S.A. is taking steps to en-
sure the following:
(1) The purchase of supplies (lubricant pipes)
with the best quality available in the market,
to secure the maximum possible strength.
(2) The implementation, on an annual basis, of
special-purpose seminars to raise personnel
awareness regarding the need to report and log
such incidents, in line with the company’s pol-
icy on the protection of the environment, as
well as regarding the use of specific techniques
to contain the extent of the spills in the soil.
(3) The existence of immediate response
methods for dealing with such incidents, col-
lecting carefully the quantity of contaminat-
ed soil and forwarding it to the hazardous
waste area for appropriate handling.
Overall, no high or medium severity environ-
mental pollution incidents occurred and no in-
cidents were reported involving the spillage of
hazardous substances to the environment by
any of the other Group companies.
27
50
40
30
20
10
0
2011
2012
2013
33
27
38
T
he total quantity of waste from our ac-
tivities during 2013 stood at 923,358
tons, slightly less (by 3%) than the corre-
sponding quantity for 2012. Of this total
quantity, 96% comes from the Metallurgy &
Mining sector and only 4% from the Group's
other activities. In terms of category, haz-
ardous waste were reduced by 5.8% and
non-hazardous ones by 2.7%.
Waste recycling and recovery is followed in all
our subsidiaries, by means of specialised pro-
cedures applied in the stages of production, man-
agement, collection, treatment/recovery and dis-
posal of the respective waste. Where waste can-
not be recycled internally, this is done trough
collective waste management systems or li-
censed waste contractors. In 2014, the total vol-
ume of waste forwarded for recycling stood at
44,211 tons, posting an impressive increase from
2012. This quantity involved mainly industrial
waste such as bauxite residues, foundry skim-
mings etc., as well as various types of materi-
als collected, including metal scrap (e.g. iron and
steel), vehicle batteries, used lubricants, elec-
trical and electronic equipment, paper, carton,
wooden pallets, home batteries and toner car-
tridges from printers and photocopiers.
When disposal is in controlled landfills, all haz-
ardous waste and aggregates and all non-haz-
ardous waste, disposed of in the Controlled
Landfill for Hazardous Waste and in the Con-
trolled Landfill for Non-Hazardous Waste, re-
spectively, of ALUMINIUM S.A. are declared,
including bauxite residues, which represent
nearly 90% of all waste produced.
The mining process and the production of
aluminium generate the main volume of the
Group's waste, which represents one of the
biggest challenges facing its Metallurgy &
Mining sector. Waste consists mainly of
bauxite residues, which result from the solu-
bilisation of the alumina contained in the baux-
ite. In order to manage efficiently this waste,
in the last years we have carried out sub-
stantial investments focusing on effective
ways for the disposal of this waste on land,
in a Group-owned area, as well as on the avail-
5.8 MANAGEMENT OF SOLID AND LIQUID WASTE
5.7 SIGNIFICANT SPILLS
2011
19,769.6
982,078.6
Hazardous waste
Non-hazardous waste
2012
20,952.6
929,231.8
2013
19,175.2
904,183.2
Rocks & stones (waste
from underground quarries)
Residues from
treatment processes
(bauxite residues)
Mud (wastewater
treatment)
2011
3,182.1
88,430.3
5.0
681,077.9
16,430.3
8.0
Recycling / Recovery
Reuse / Reutilisation
Incineration (or use as fuel)
Controlled Landfills for Non-Hazardous Waste
Controlled Landfills for Hazardous Waste
Uncontrolled Landfills (household waste)
Storage on-site
2012
4,957.7
28,295.2
28.5
832,028.0
16,997.3
6.0
66,100.0
2013
44,211.8
28,295.2
15.0
808,960.0
19,020.0
6.0
26,211.0
2013
267,479
807,272.95
86.04
WASTE QUANTITIES FROM THE GROUP'S ACTIVITIES, BY CATEGORY (TN)
WASTE SPECIFIC TO THE
METALLURGY & MINING
SECTOR (TN)
NUMBER OF INCIDENTS INVOLVING
SPILLAGE OF LUBRICANTS IN THE SOIL
10
8
6
4
2
0
2011
2012
2013
5
3.5
4.2
QUANTITY OF LUBRICANT SPILLAGE
IN NTHE SOIL (tn)
Number of spillage incidents
Spillage quantity (tn)
WASTE QUANTITIES BY DISPOSAL METHOD (TN)


